Report Center
The Report Center provides powerful data analysis functions, allowing you to query, manage, and automatically generate various device reports to gain deep insights into device status and activities.
Regular Reports
Section titled “Regular Reports”You can generate regular reports using report templates.
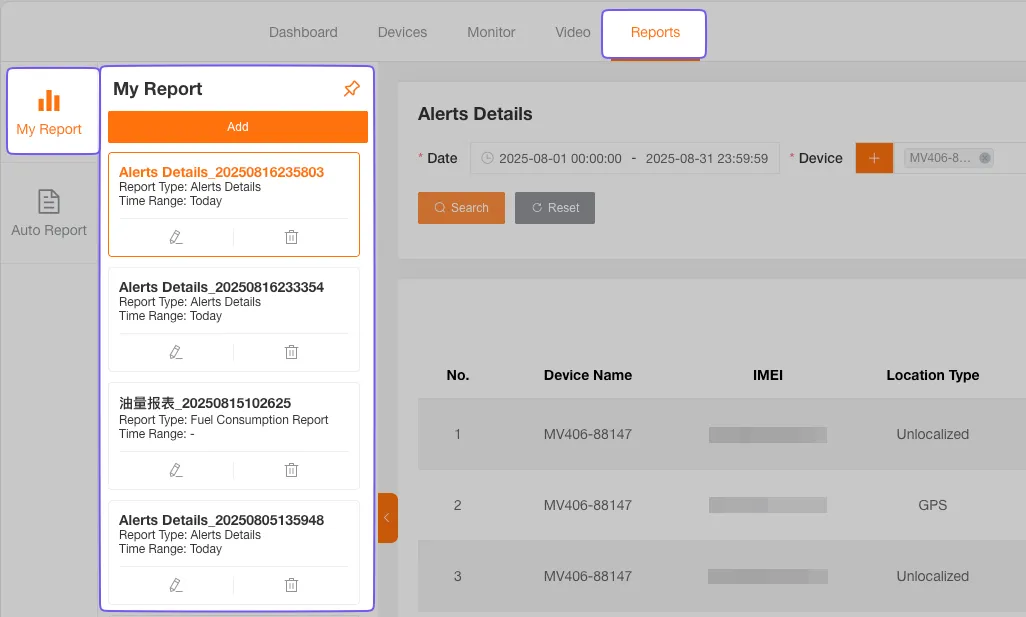
In the report list, you can view the created report templates.
Create a Regular Report Template
Section titled “Create a Regular Report Template”-
Click the Create button, select a report type, and fill in the report name.

-
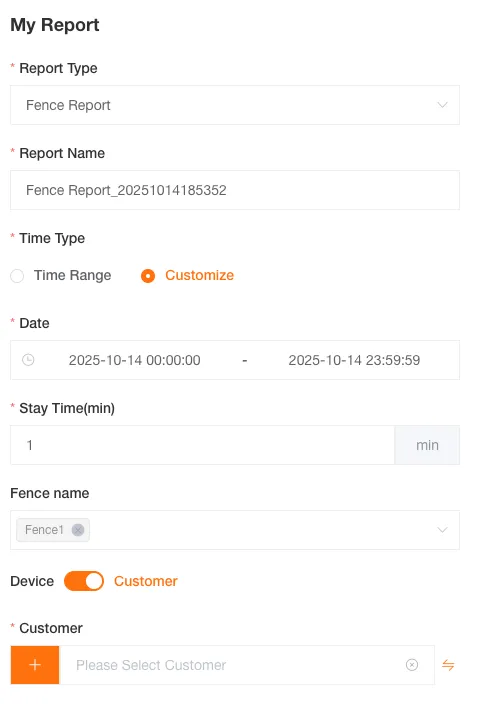
Select the report type, fill in and save the template conditions to complete the creation of the regular report template.
Edit a Regular Report Template
Section titled “Edit a Regular Report Template”You can click the Edit button below the regular report template card to edit the template.
Delete a Regular Report Template
Section titled “Delete a Regular Report Template”You can click the Delete button below the regular report template card to permanently delete the template.
Export a Regular Report
Section titled “Export a Regular Report”You can click the Export button in the report to export the regular report file.
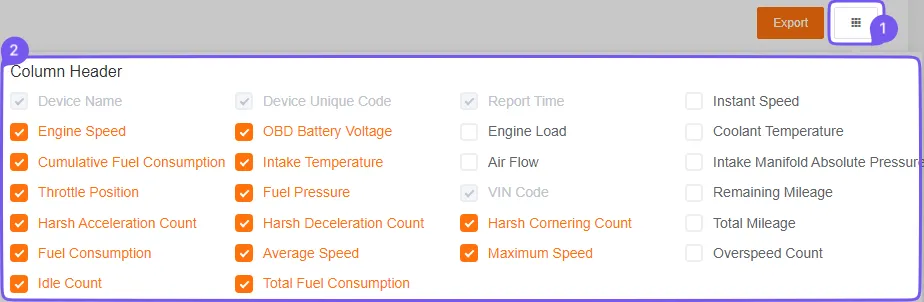
Customize Report Headers
Section titled “Customize Report Headers”Some regular reports offer a feature to customize the report headers, allowing you to show or hide certain columns as needed.
Map Location
Section titled “Map Location”The latitude and longitude coordinates in regular reports are clickable. After clicking, a map location information box will pop up, displaying detailed information about the device (including device name, IMEI, time, coordinates, address) and its specific location on the map.

Automated Reports
Section titled “Automated Reports”You can generate automated reports through automated tasks, allowing the system to generate reports on a schedule and automatically send them to a specified email address.
In the automated report list, you can view the created tasks.

Create an Automated Report Task
Section titled “Create an Automated Report Task”-
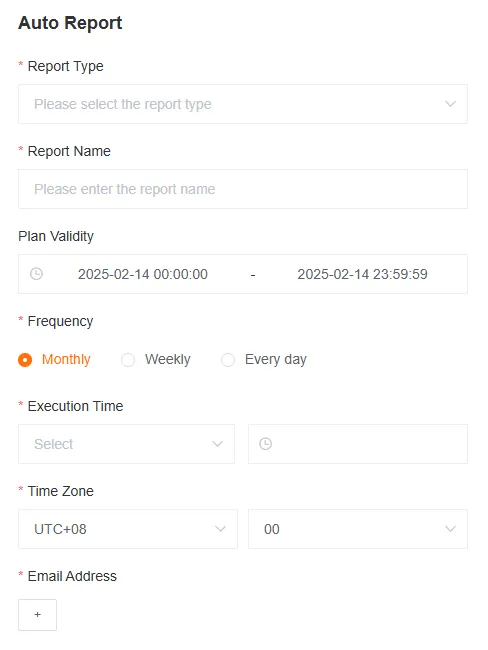
Click the Create button, select a report type, and fill in the report name.
Fill in the report name, report type, schedule validity period, frequency, execution time, time zone (defaults to your current time zone), and email address for the automated task.
-
Select the report type, fill in and save the automated task conditions to complete the creation of the automated report task.
Edit an Automated Report Task
Section titled “Edit an Automated Report Task”You can click on an automated report task card to edit the conditions for that task.
Delete an Automated Report Task
Section titled “Delete an Automated Report Task”You can click the Delete button below the automated report task card to permanently delete the task.
Manually Download an Automated Report
Section titled “Manually Download an Automated Report”After an automated report task has been successfully executed, you can click the Download button to manually download the report file.
Geofence Report
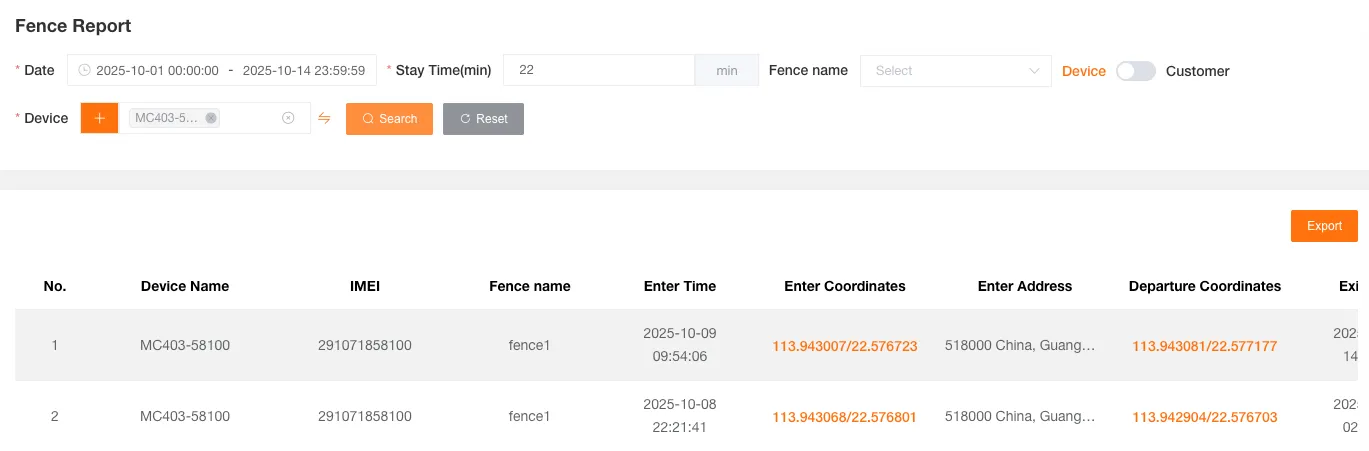
Section titled “Geofence Report”Used to query records of devices entering and exiting geofences. Can be filtered by date, duration of stay, geofence name, and customer or device.
The form includes Device Name, Unique ID, Geofence Name, Entry Time, Entry Coordinates, Entry Address, Exit Coordinates, Exit Time, Exit Address.
Load Report
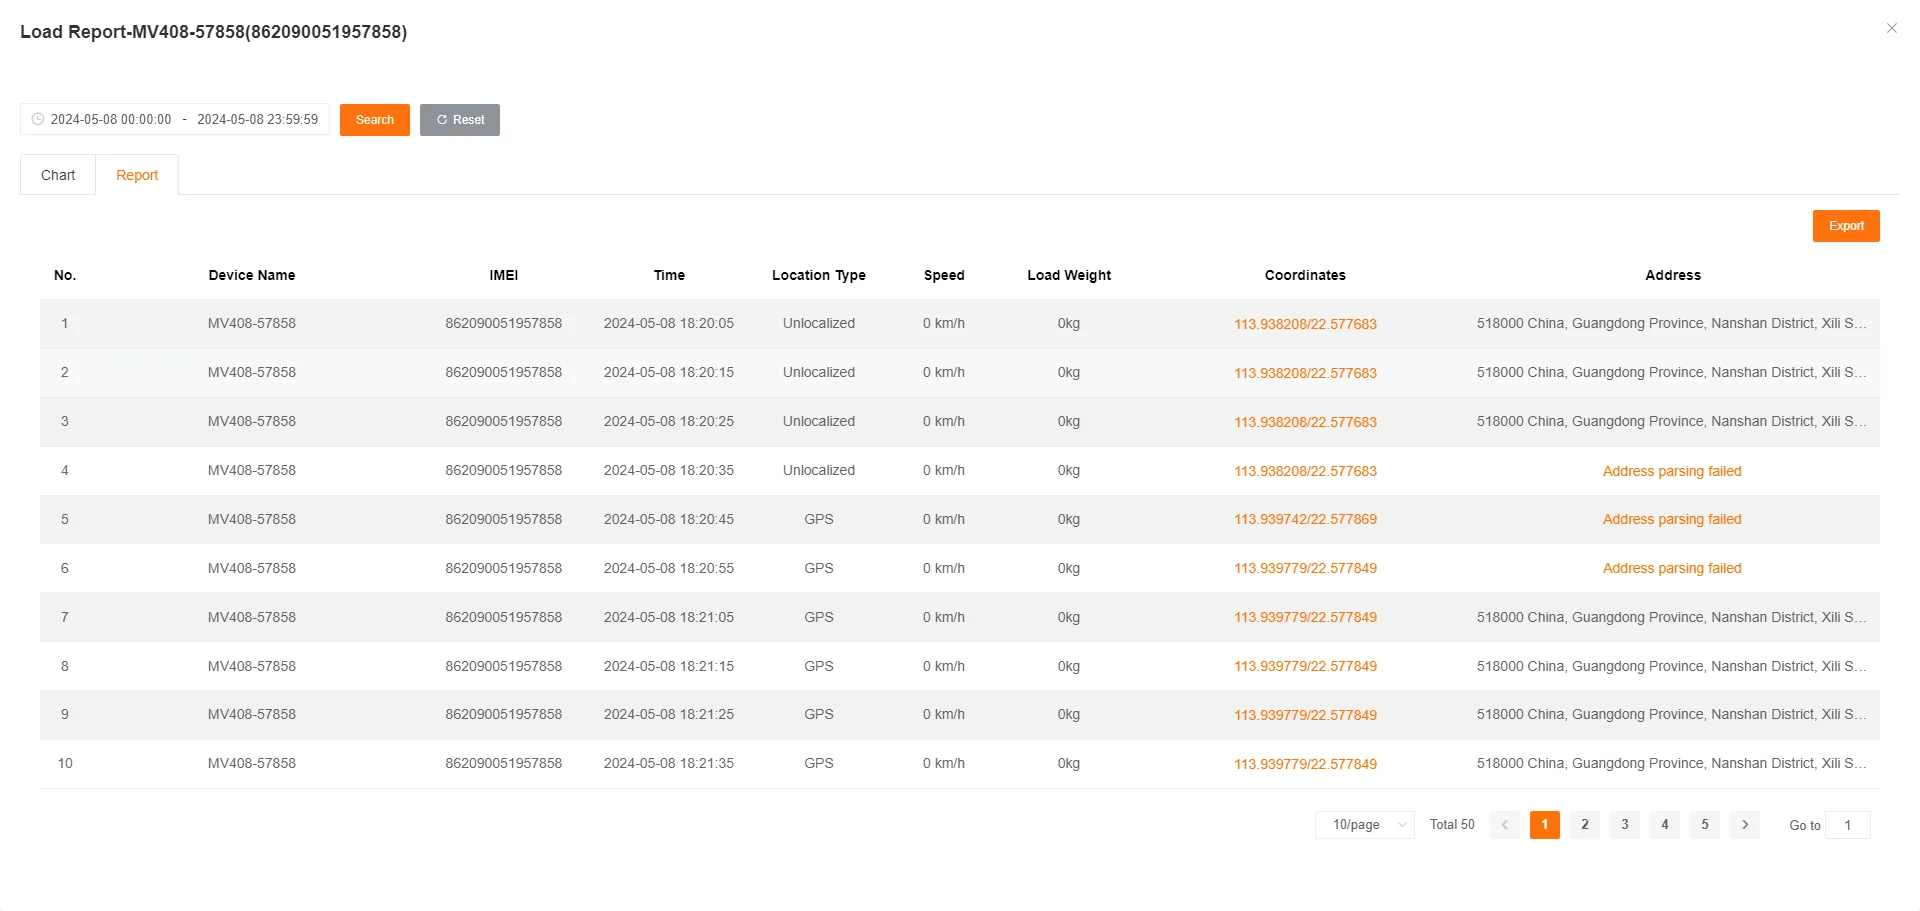
Section titled “Load Report”Used to query the load data of devices. Can be filtered by customer or device and load threshold.
The form includes Device Name, Unique ID, Report Time, Positioning Type, Speed, Load Weight, Coordinates, Address.

Click History to view the historical load curve graph and detailed data report for the selected device.

Track Detail Report
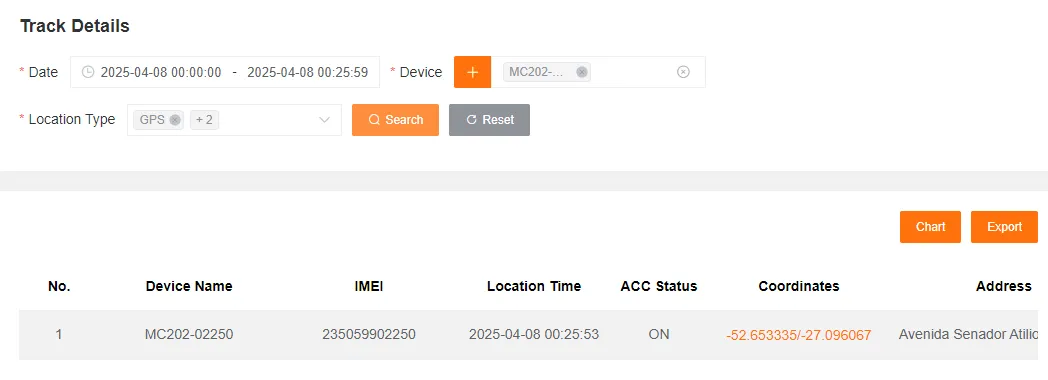
Section titled “Track Detail Report”Used to query the detailed track of a specific device. Can be filtered by date, device (single selection), and positioning type.
The form includes Device Name, Unique ID, Positioning Time, ACC Status, Coordinates, Address, Speed, Direction, Number of Satellites, Positioning Type, Report Type.
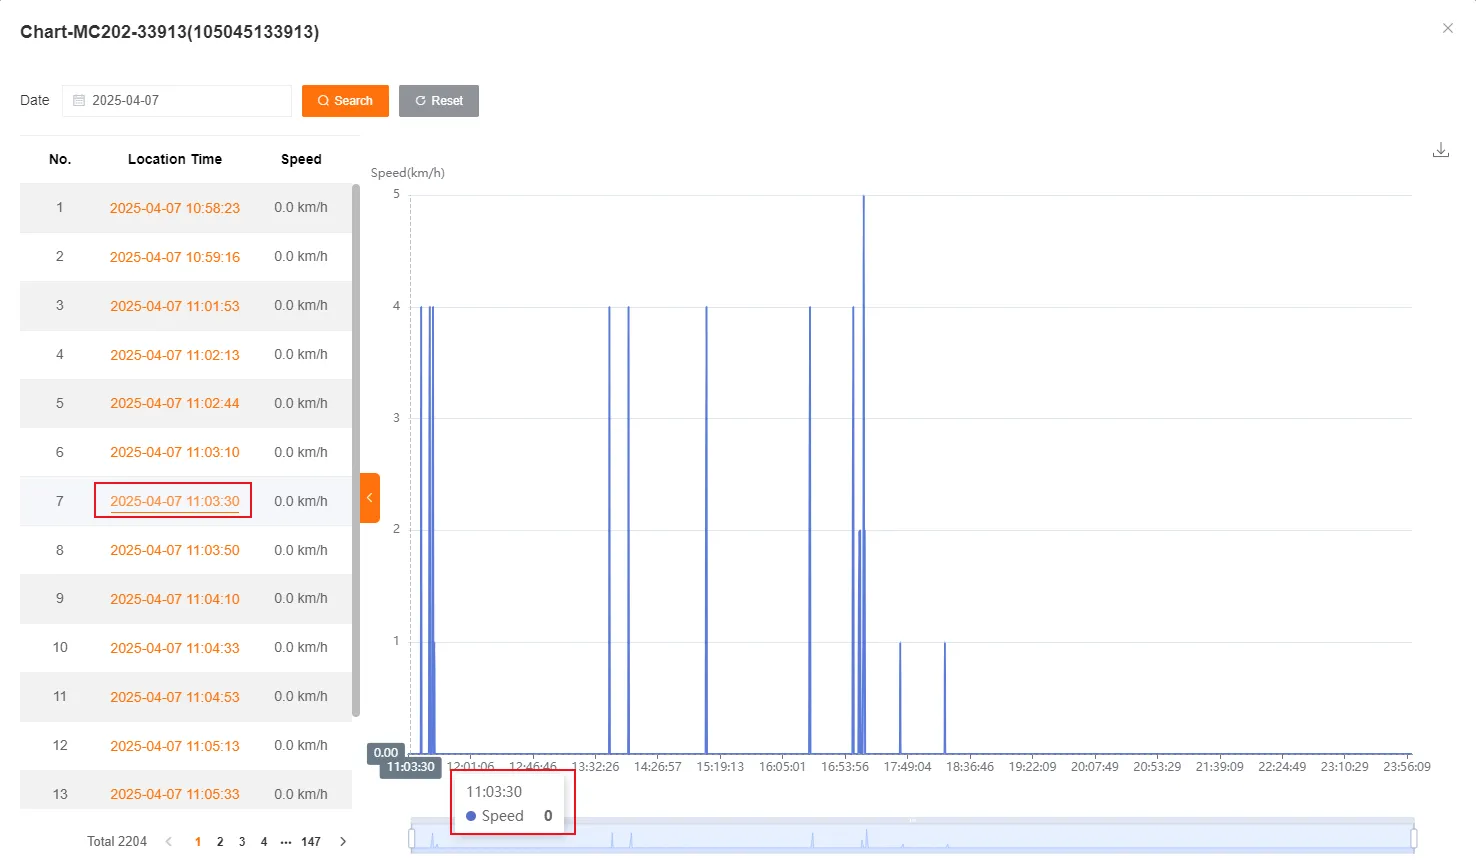
Track Analysis
Section titled “Track Analysis”You can view the speed curve graph for the device within the selected date range.
Click on a time point in the data list on the left, and the corresponding data point will be highlighted on the curve graph.
Remaining Battery Report
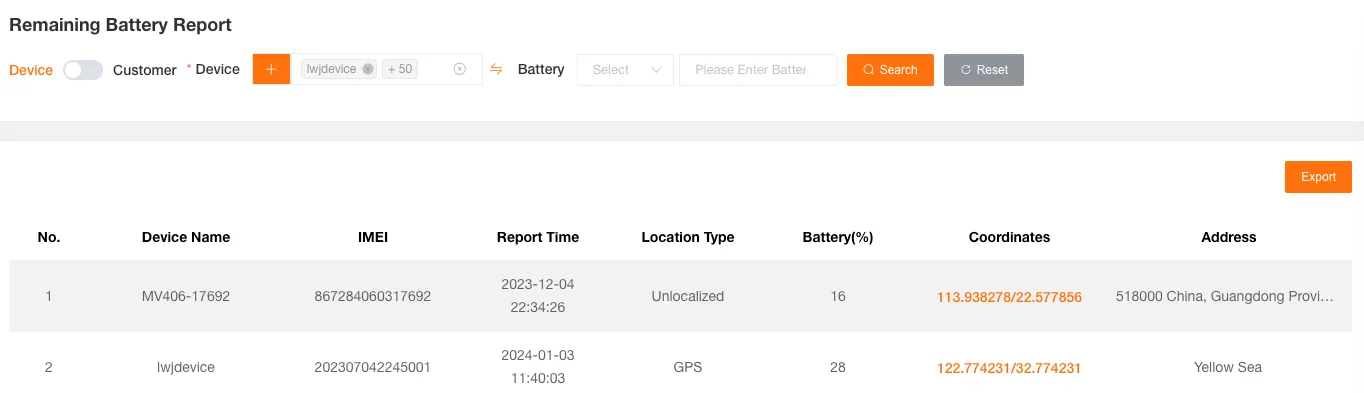
Section titled “Remaining Battery Report”Used to query the remaining battery records of devices. Can be filtered by customer or device, date, and remaining battery threshold.
The form includes Device Name, Unique ID, Report Time, Positioning Type, Remaining Battery Percentage, Coordinates, Address.
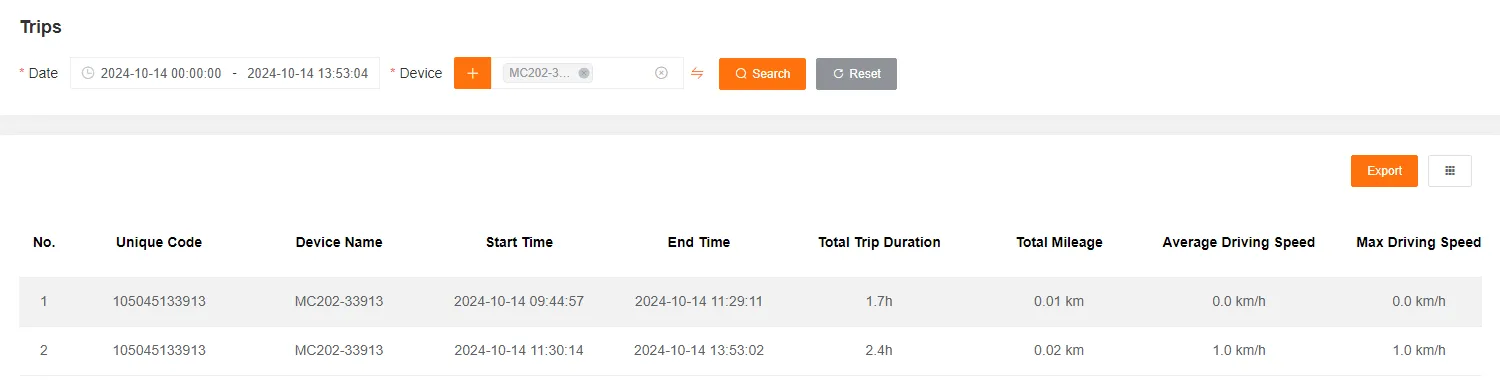
Trip Detail Report
Section titled “Trip Detail Report”Used to query the detailed trip records of devices. Can be filtered by date and customer or device.
The form includes Unique ID, Device Name, Start Time, End Time, Total Duration, Total Mileage, Average Driving Speed, Maximum Driving Speed, Total Fuel Consumption, Fuel Consumption per 100 km, Start Coordinates, End Coordinates, Start Address, End Address.
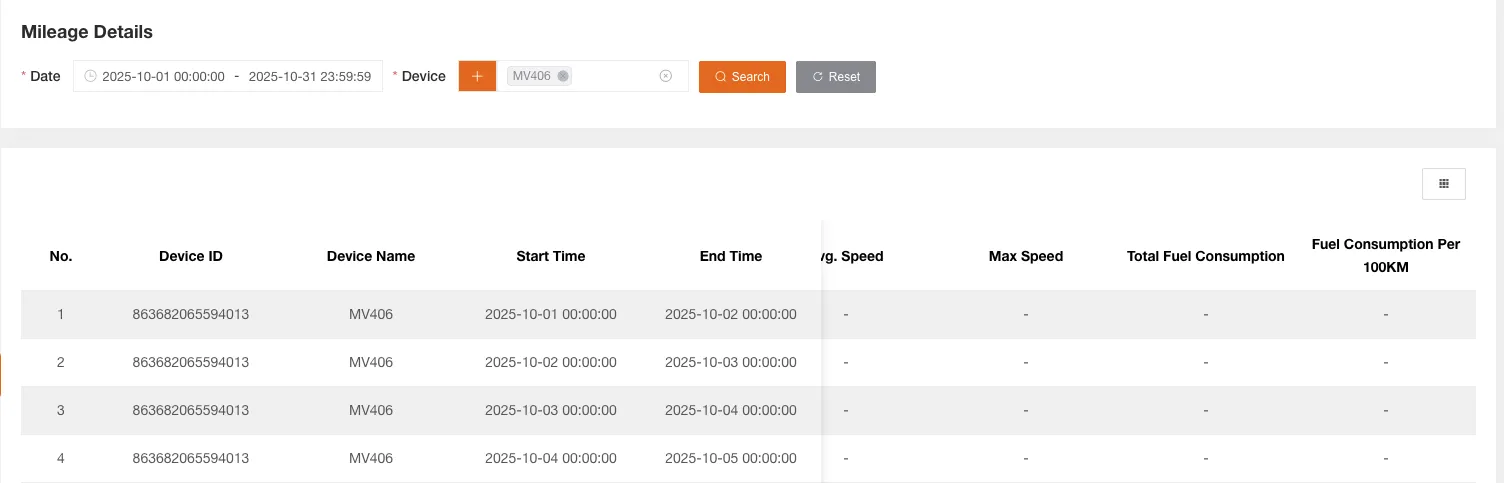
Mileage Detail Report
Section titled “Mileage Detail Report”Used to query the mileage details of devices by day. Can be filtered by date or device.
The form includes Device Name, Unique ID, Start Time, End Time, Number of Trips, Total Mileage, Total Duration, Average Driving Speed, Maximum Driving Speed, Total Fuel Consumption, Fuel Consumption per 100 km.
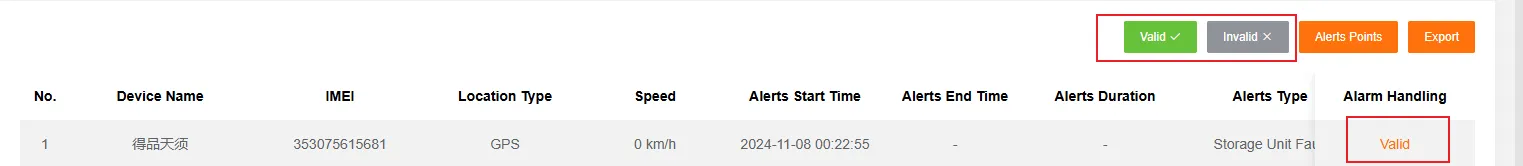
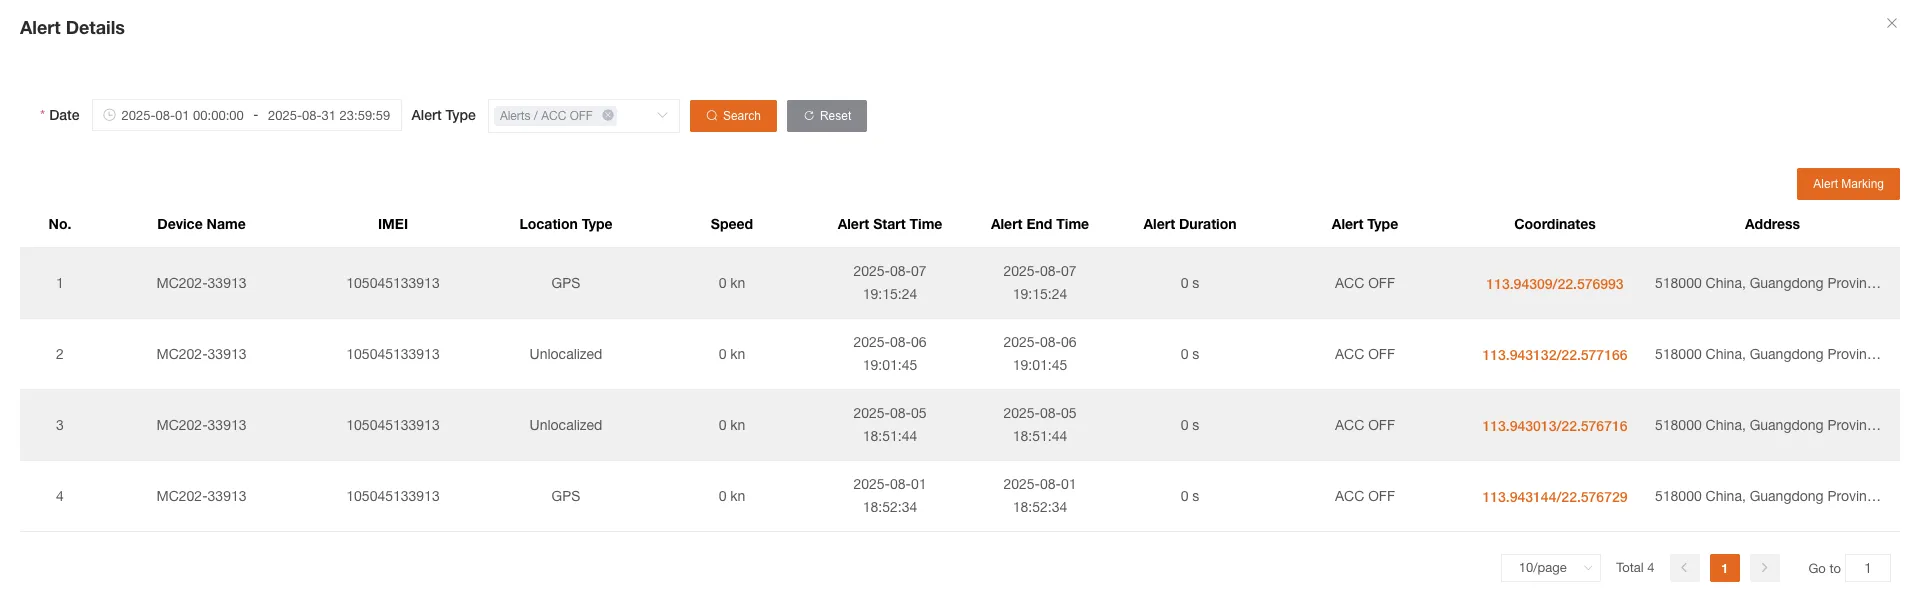
Alert Detail Report
Section titled “Alert Detail Report”Used to query the detailed alert records of devices. Can be filtered by date, customer or device, alert type, and alert processing type.
The form includes Device Name, Unique ID, Positioning Type, Speed, Alert Start Time, Alert End Time, Alert Duration, Alert Type, Coordinates, Address.
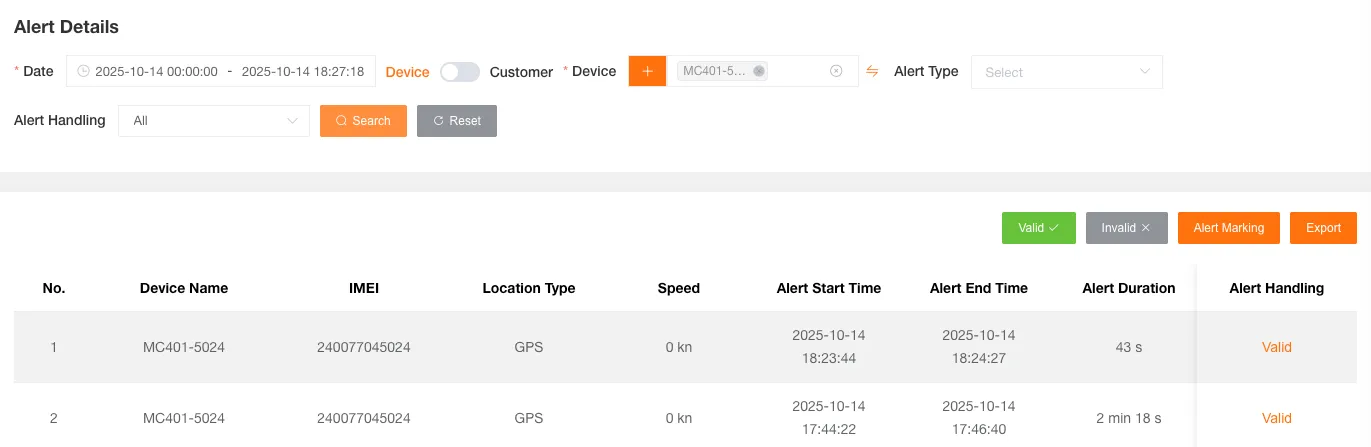
You can click the Valid or Invalid buttons to batch mark alerts, and single record operations are also supported.
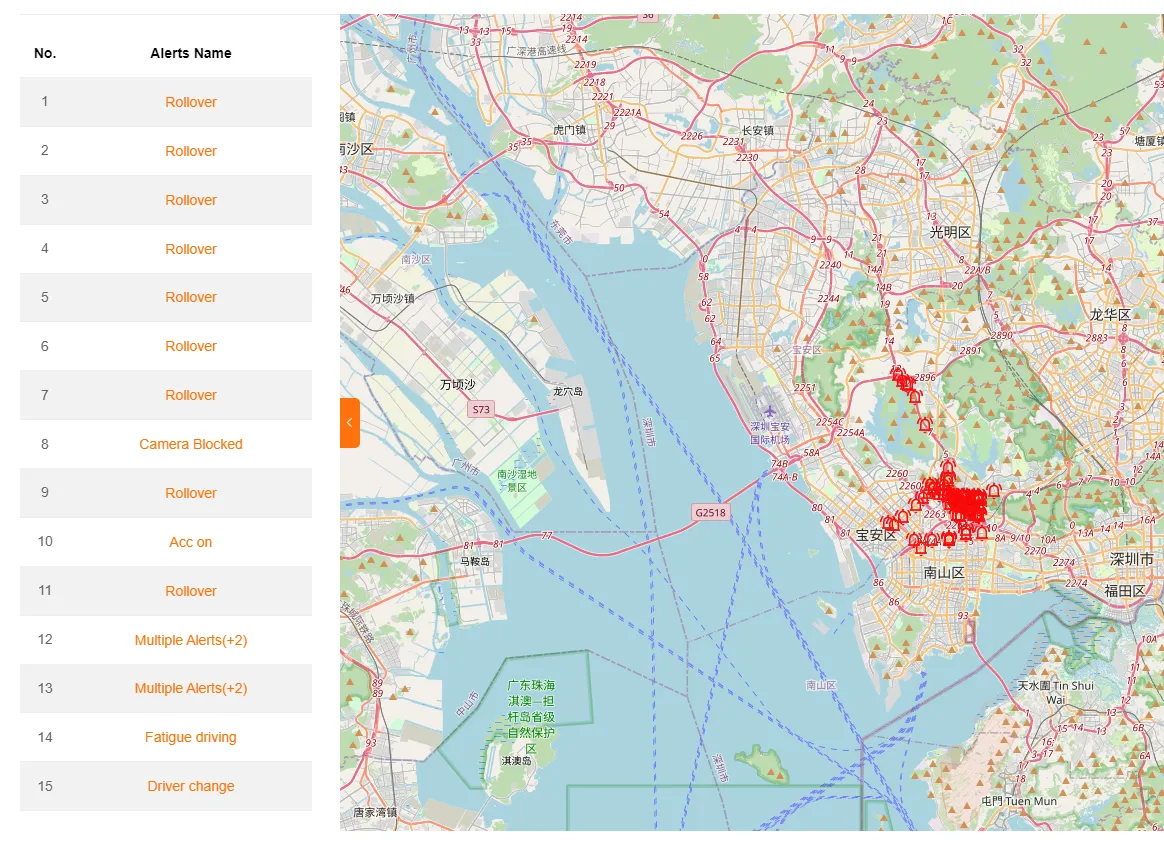
Alert Points
Section titled “Alert Points”Click the Alert Points button to view the locations of all alerts from the current query on the map.
If the alert points on the map are too dense, a single click may not select a specific one. In this case, a list will pop up showing all alert points within the clicked area, allowing you to make a further selection.
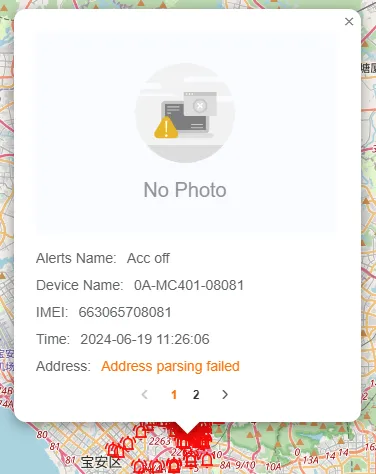
The alert point information box will display information such as Alert Name, Device Name, IMEI, Alert Time, Address. For AI alerts, related alert images and videos will also be shown.
Multiple alerts triggered at the same location will be merged and displayed in the same information box, and you can view them one by one by paging through.
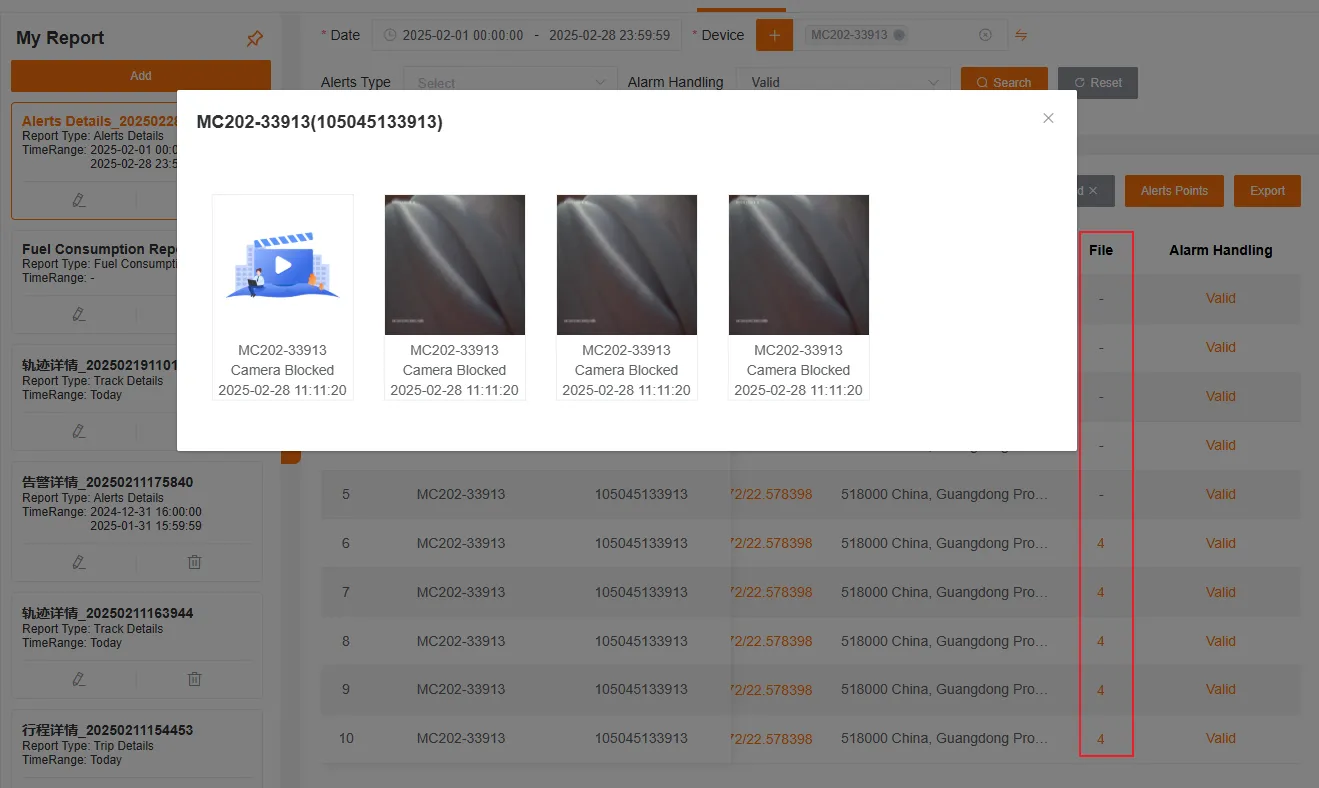
Alert Files
Section titled “Alert Files”In the alert list, the Files column will show the number of related alert files. Clicking the number will take you to the file viewing interface, which is consistent with the file viewing function in the video AI alert records, supporting image zoom preview and allowing you to mark alerts as valid or invalid.
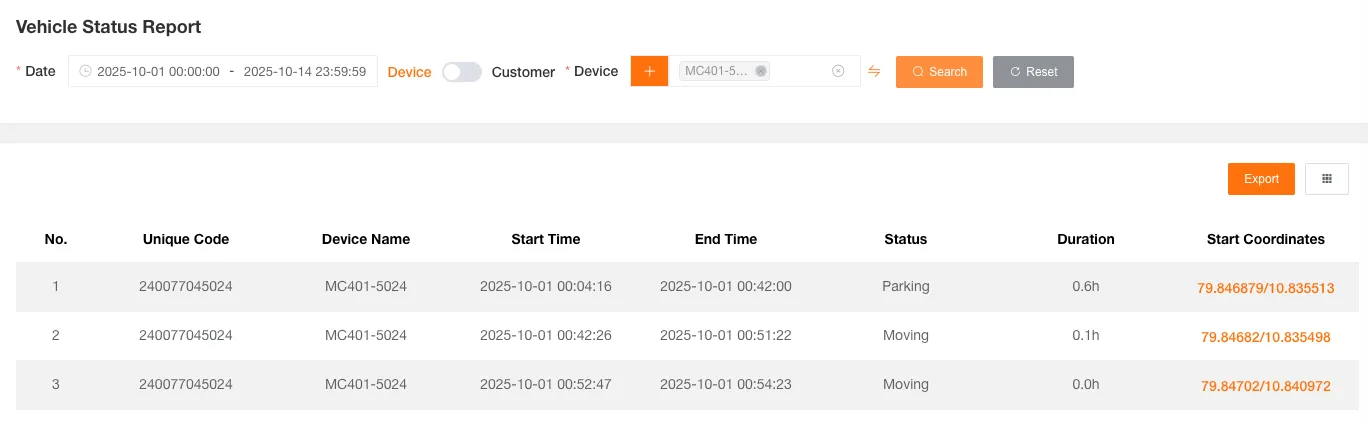
Vehicle Status Report
Section titled “Vehicle Status Report”Used to query the driving status of devices. Can be filtered by date and customer or device.
The form includes Device Name, Unique ID, Start Time, End Time, Status, Duration, Start Coordinates, End Coordinates, Start Address, End Address.
Mileage Statistics
Section titled “Mileage Statistics”Used to query the mileage statistics of devices. Can be filtered by customer or device and mileage threshold.
The form includes Device Name, Unique ID, Report Time, Device Mileage, Coordinates, Address.
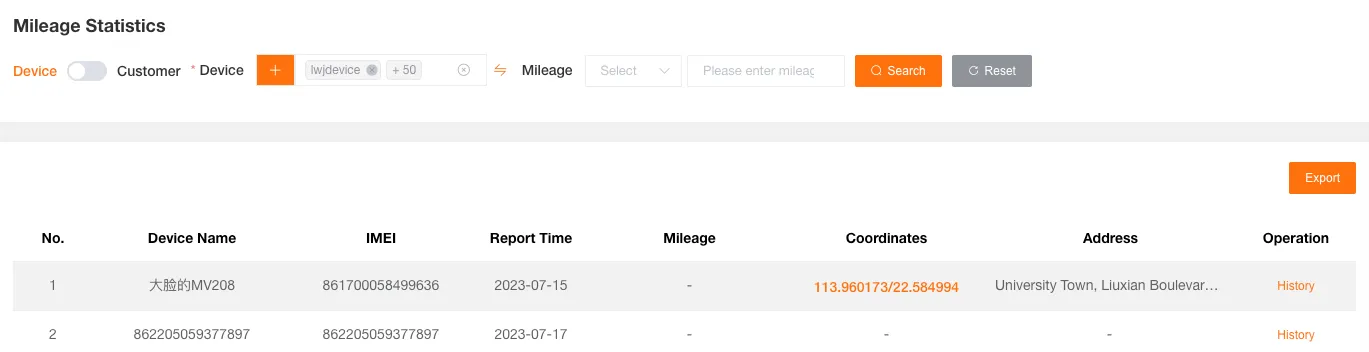
Click History to view the historical mileage statistics curve graph and detailed data report for the selected device.


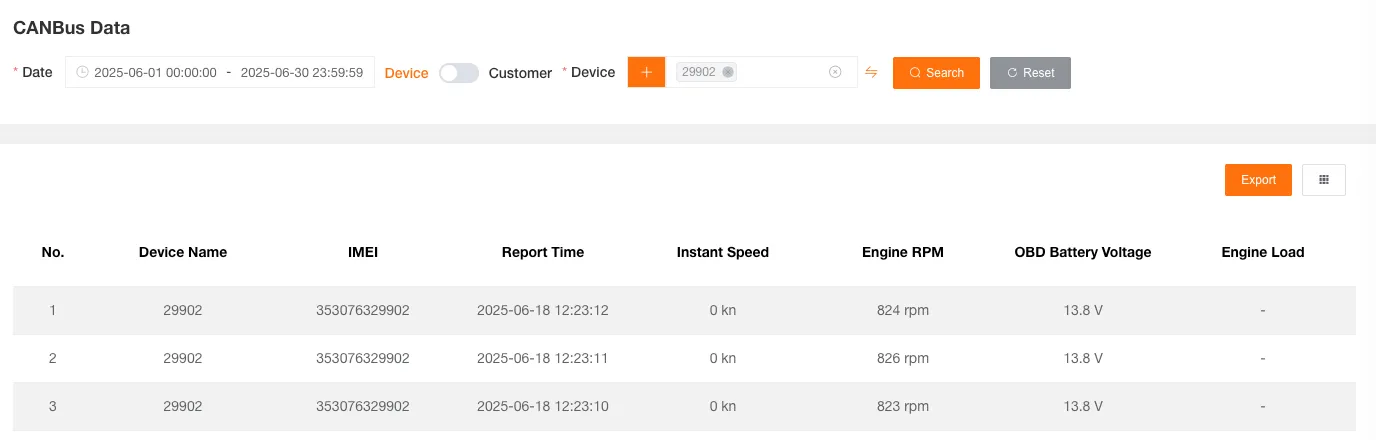
CAN bus Report
Section titled “CAN bus Report”Used to query the CAN bus data of devices. Can be filtered by date and customer or device.
The form includes information such as Device Name, Unique ID, Report Time, Instantaneous Speed, Engine Speed, OBD Battery Voltage, Engine Load, Coolant Temperature, Instantaneous Fuel Consumption, Intake Air Temperature.
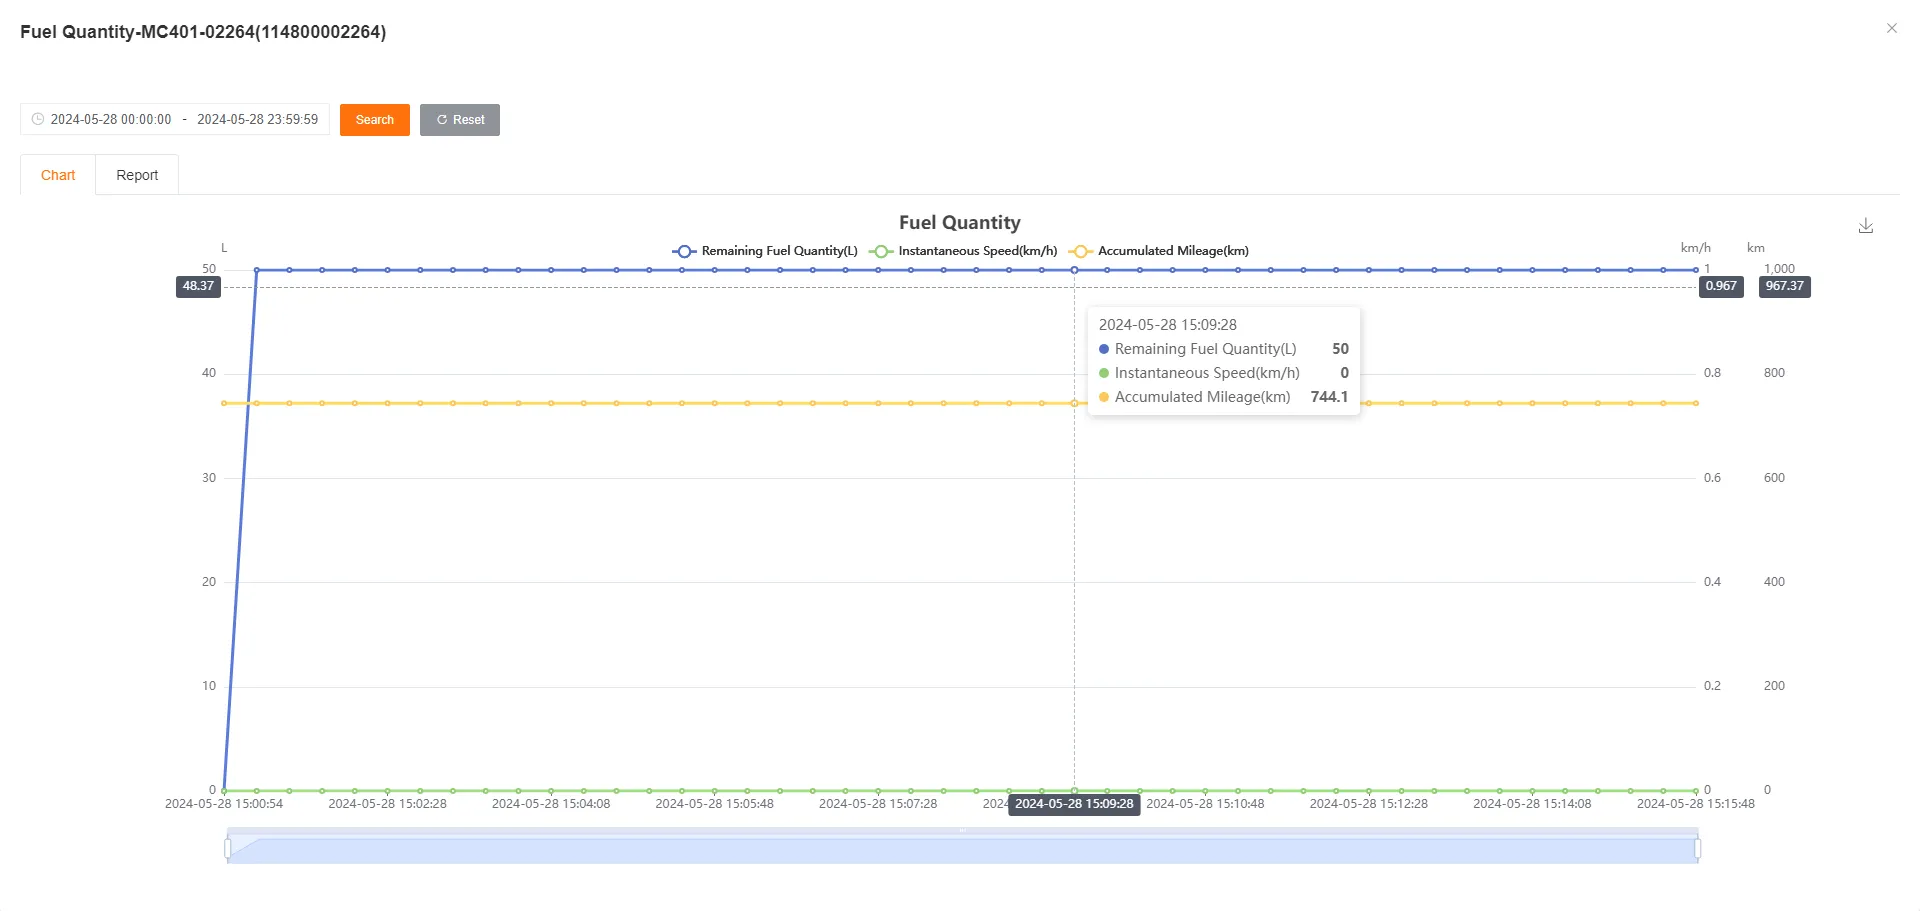
Fuel Report
Section titled “Fuel Report”Used to query the fuel level change records of devices. Can be filtered by customer or device and fuel level threshold.
The form includes Device Name, Unique ID, Report Time, Positioning Type, Remaining Fuel, Coordinates, Address.
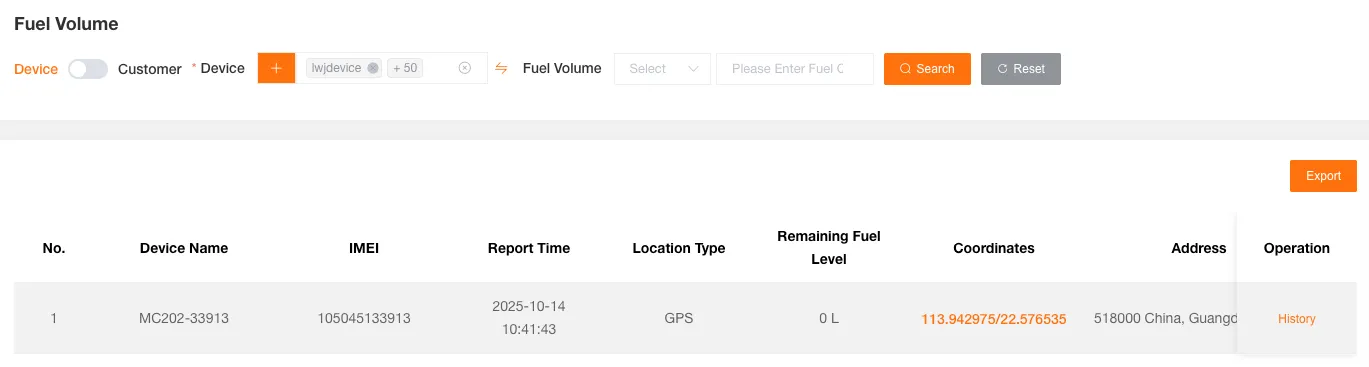
Click History to view the historical curve graphs for remaining fuel, instantaneous speed, and cumulative mileage, as well as a detailed data report for the selected device.

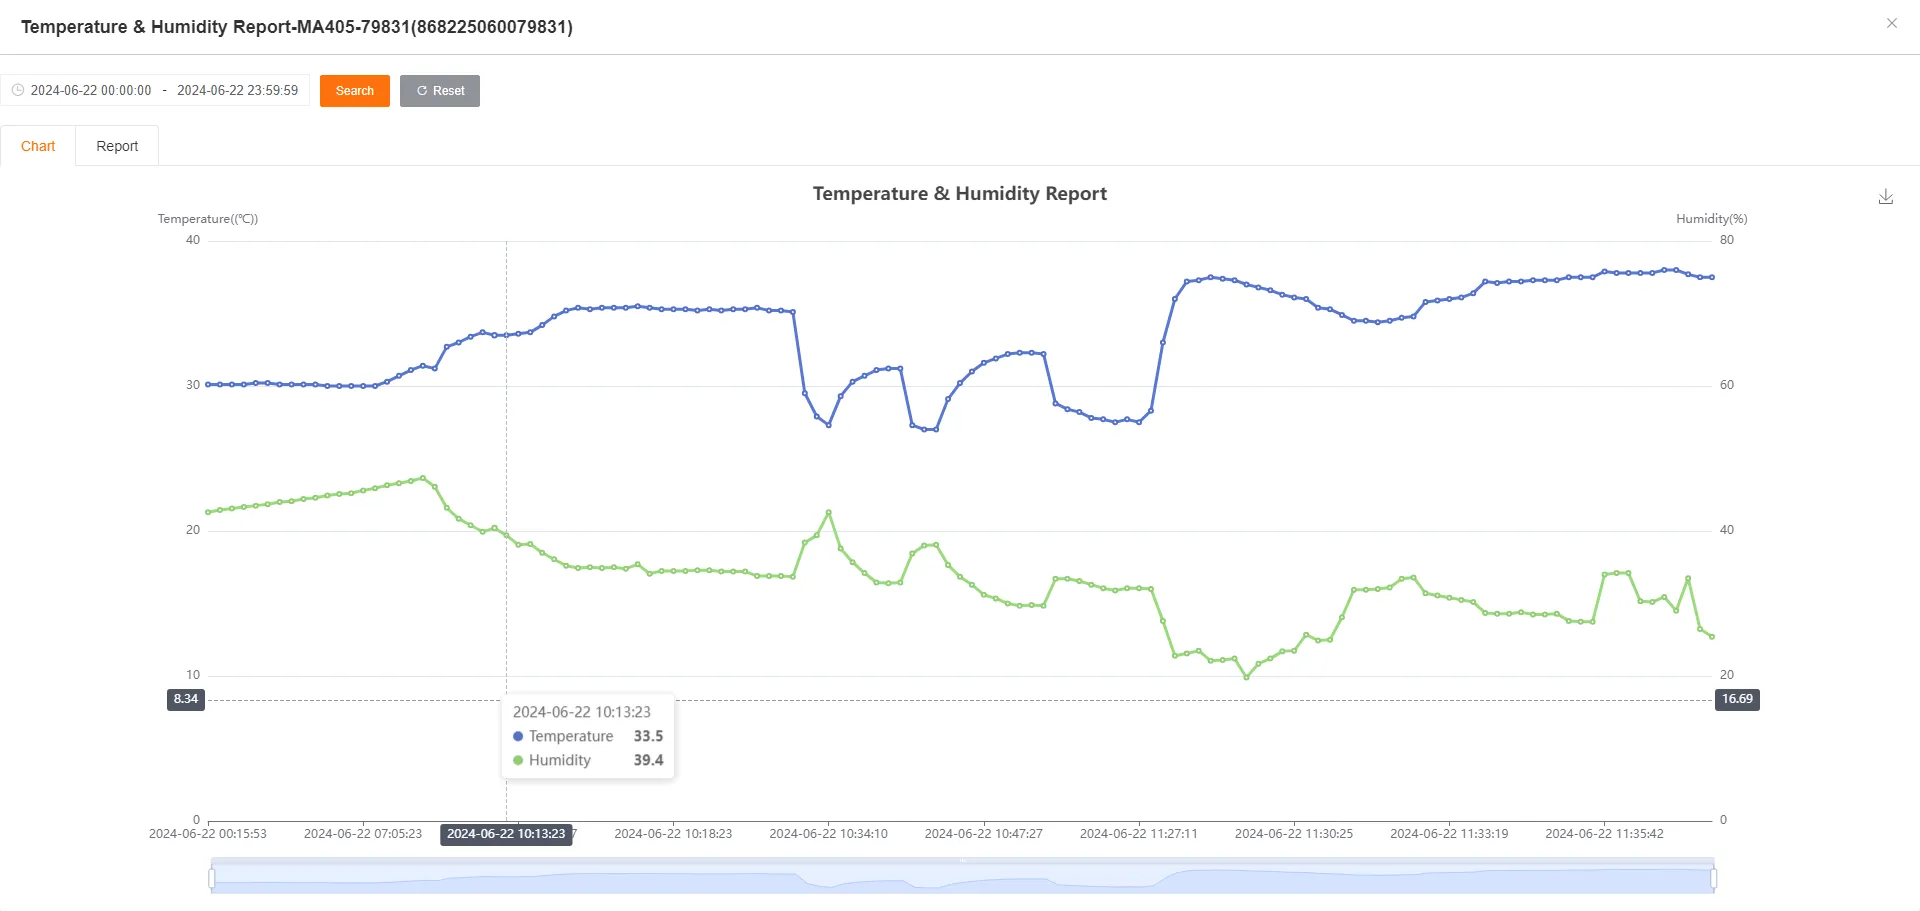
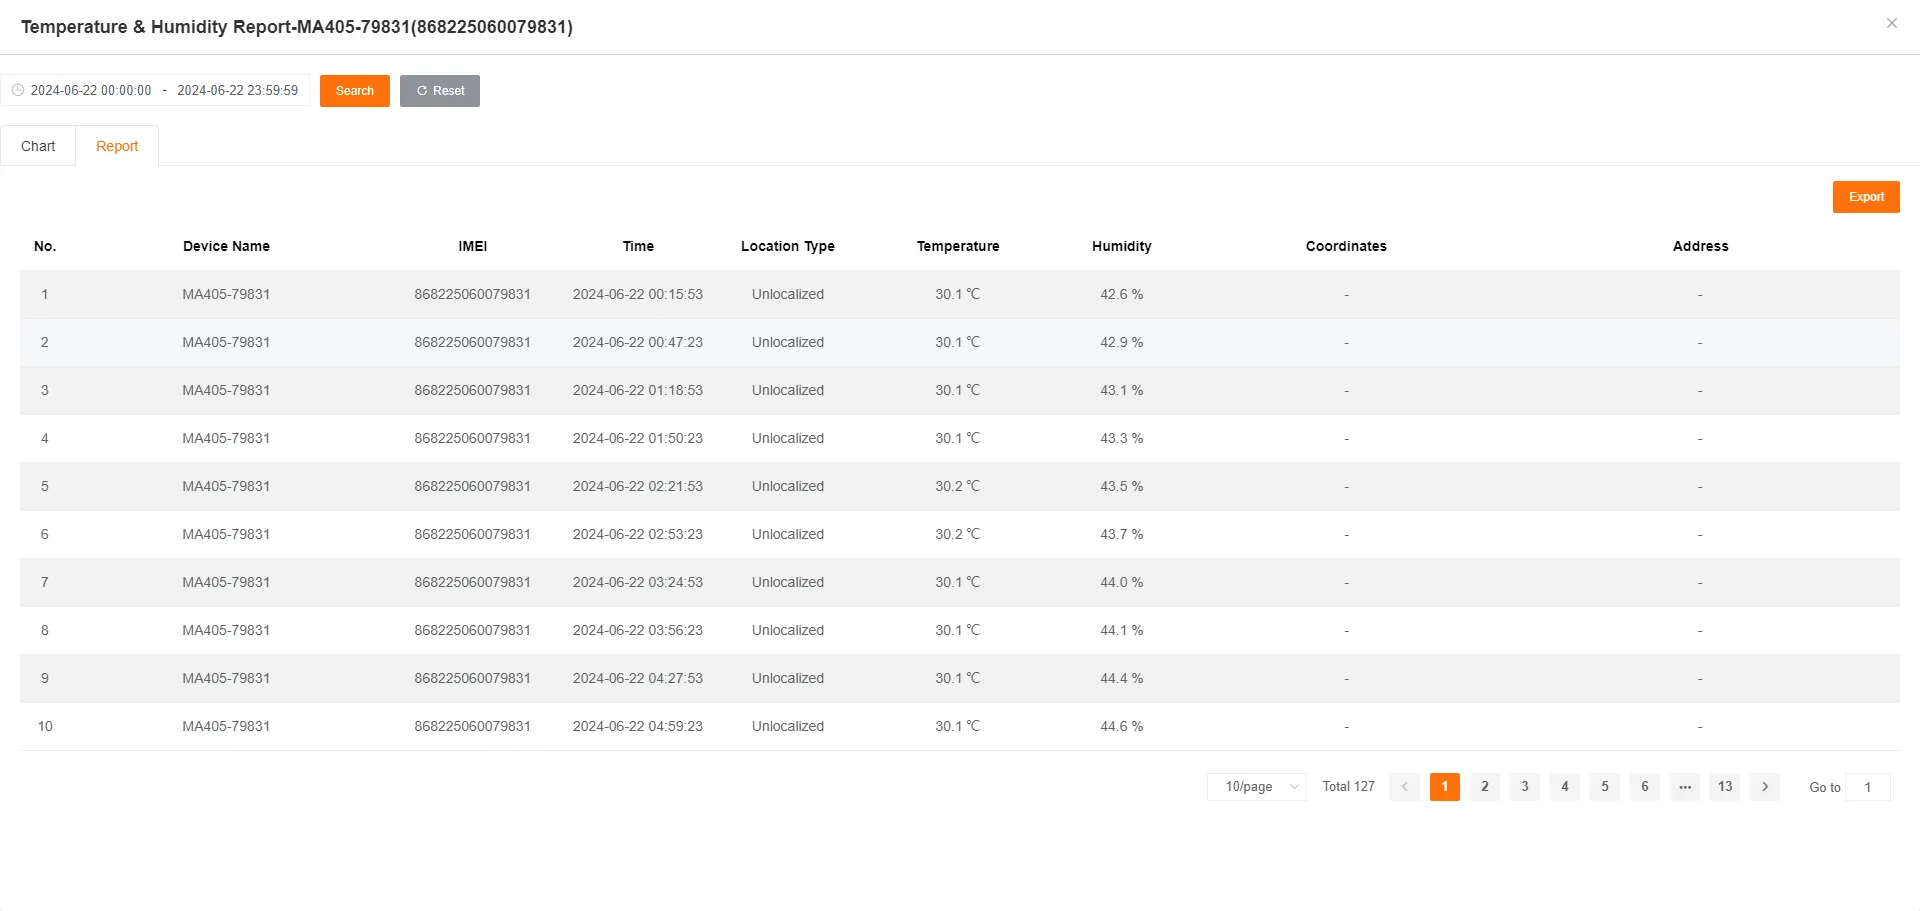
Temperature and Humidity Report
Section titled “Temperature and Humidity Report”Used to query the temperature and humidity data records of devices. Can be filtered by customer or device, temperature threshold, and humidity threshold.
The form includes Device Name, Unique ID, Report Time, Positioning Type, Temperature, Humidity, Coordinates, Address.
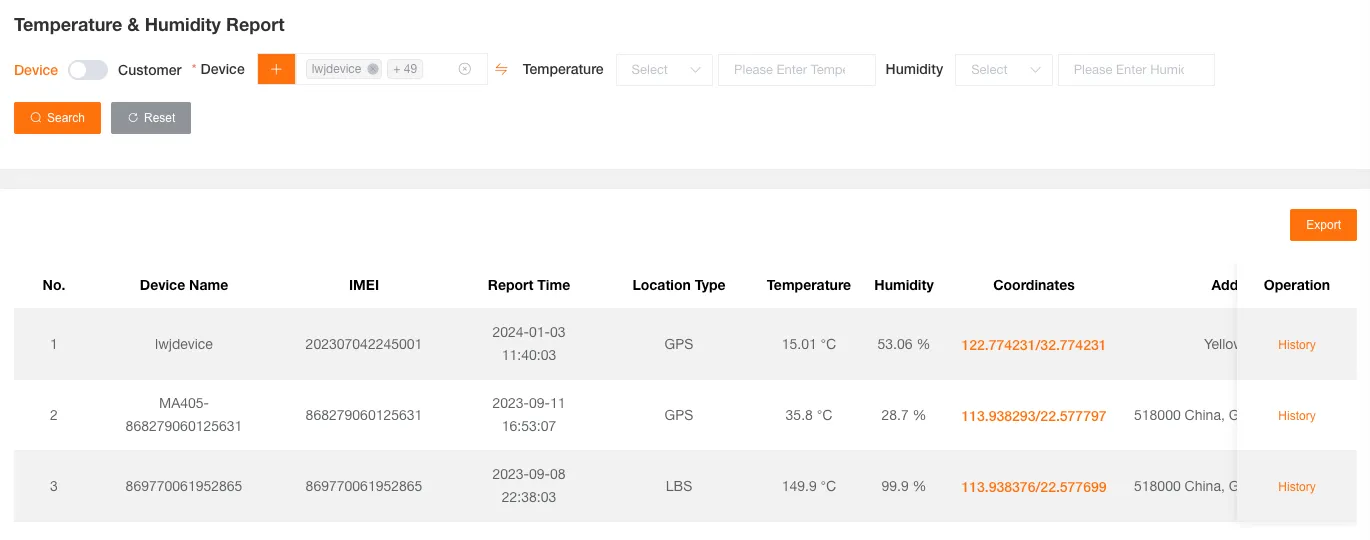
Click History to view the historical temperature and humidity curve graph and detailed data report for the selected device.
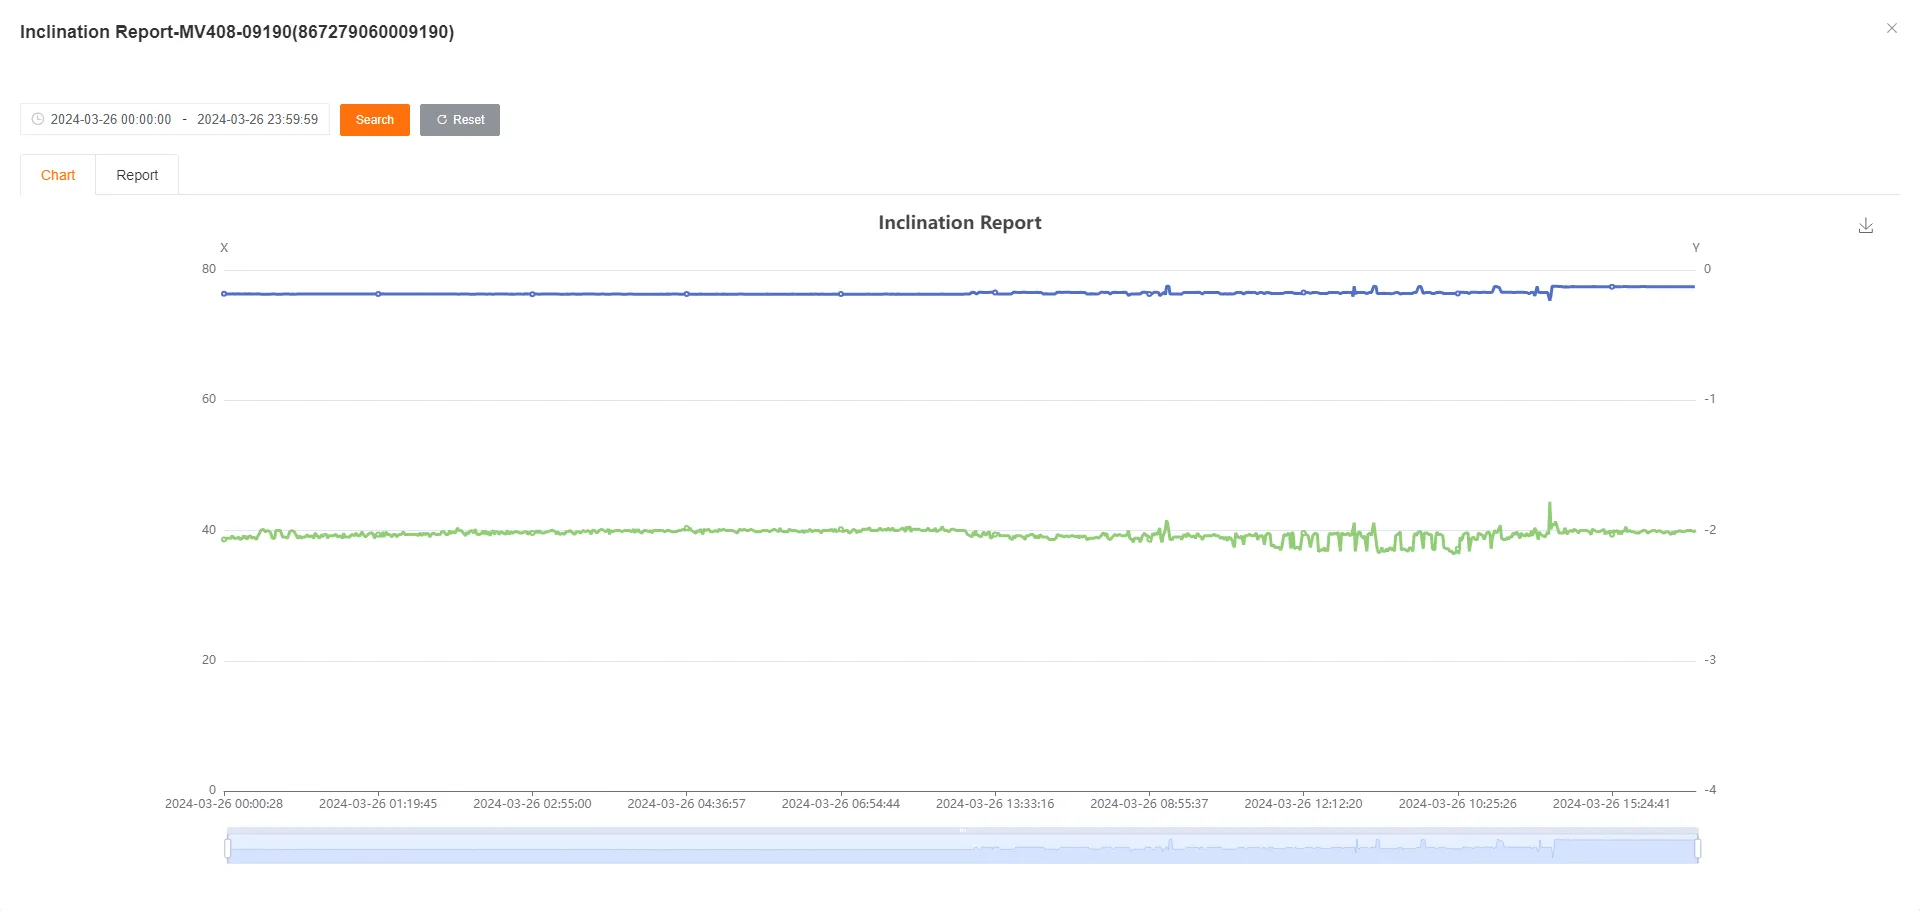
Tilt Report
Section titled “Tilt Report”Used to query the tilt data records of devices. Can be filtered by customer or device.
The form includes Device Name, Unique ID, Report Time, Positioning Type, X, Y, Coordinates, Address.

Click History to view the historical curve graph for the X/Y axis tilt and a detailed data report for the selected device.

Configuration Rule Report
Section titled “Configuration Rule Report”Used to query records of devices triggering configuration rules. Can be filtered by date, customer or device, and rule name.
The form includes Device Name, Unique ID, Report Time, Positioning Type, Rule Name, Rule Type, Coordinates, Address.
Supports Re-uploading for failed rule video uploads and Deleting records.

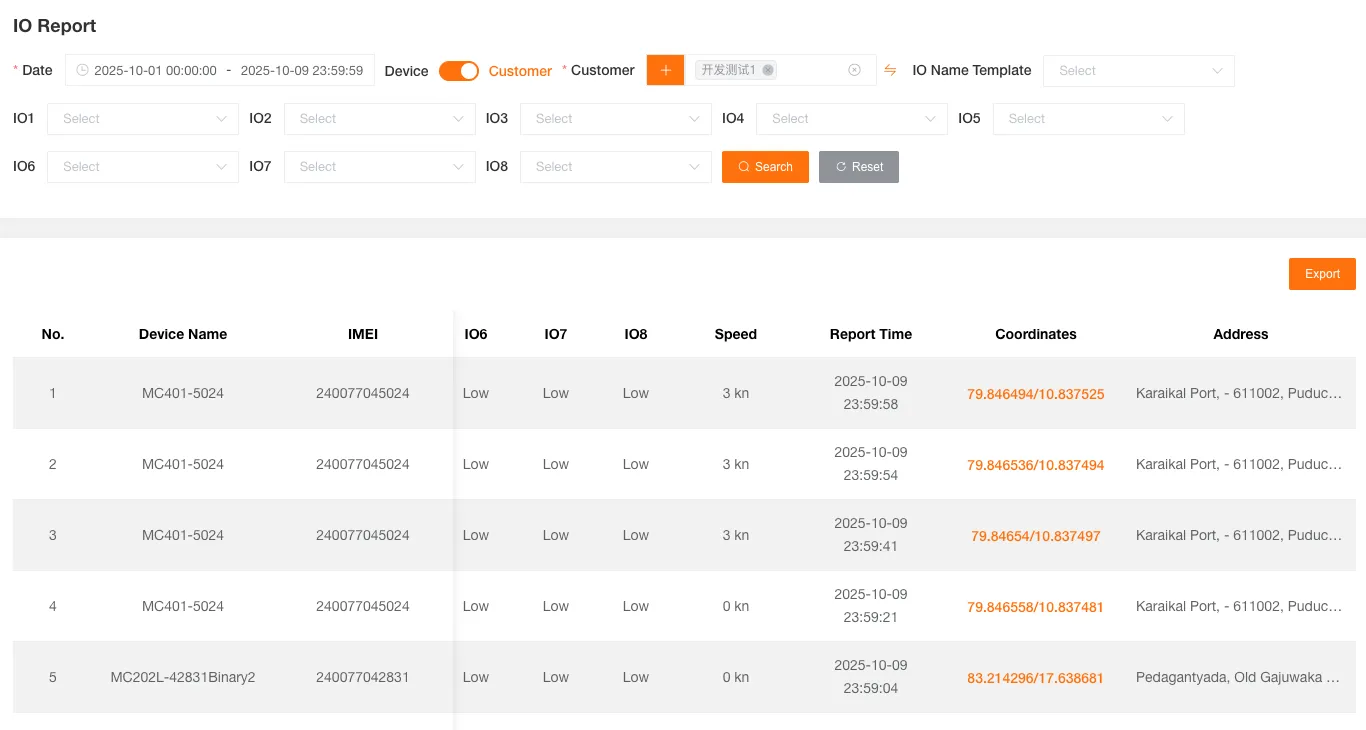
I/O Report
Section titled “I/O Report”Used to query the I/O status reporting records of devices. Can be filtered by date, customer or device, and I/O port.
The form includes Device Name, Unique ID, I/O Port, Speed, Report Time, Coordinates, Address.
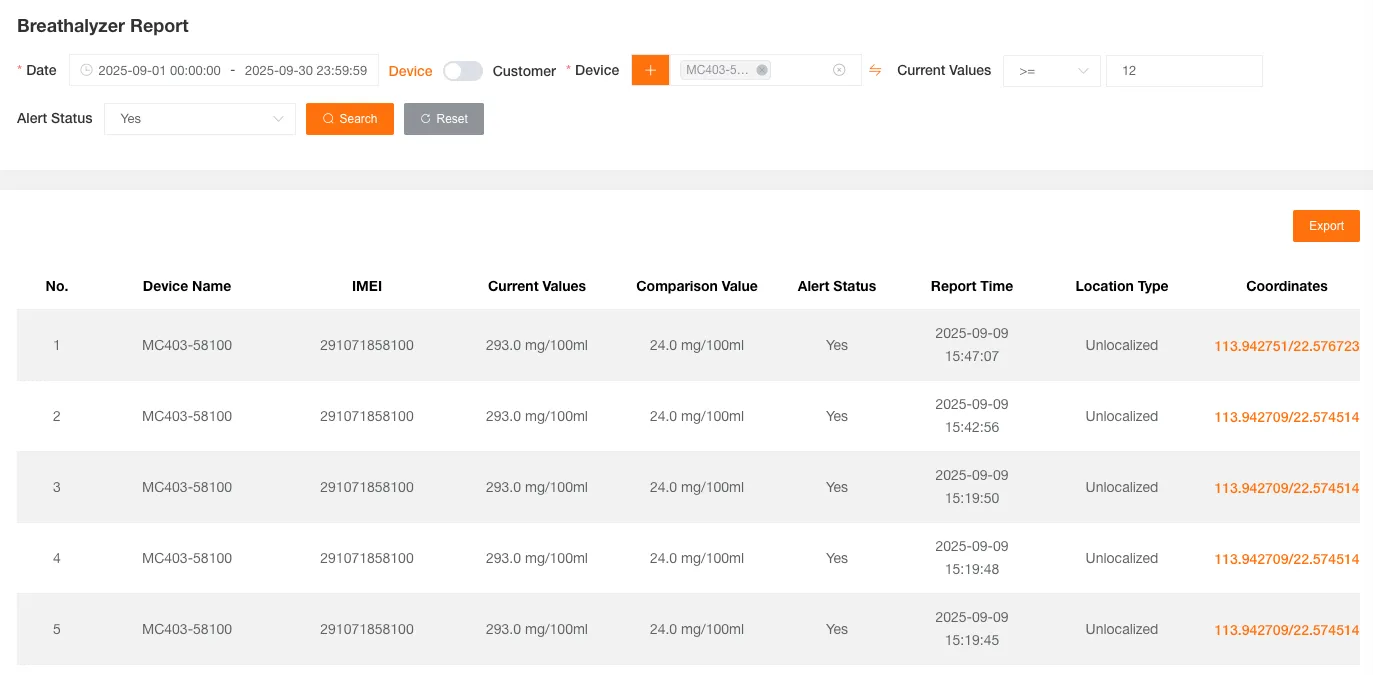
Alcohol Tester Report
Section titled “Alcohol Tester Report”Used to query the reporting records of the alcohol tester. Can be filtered by date, customer or device.
The form includes Device Name, Unique ID, Current Value, Comparison Value, Alert Status, Report Time, Coordinates, Address.
Alert Evidence Report
Section titled “Alert Evidence Report”Used to query device linkage alert information and corresponding captured videos. Can be filtered by date, customer or device, and linkage alert type.
The form includes Device Name, Unique ID, Channel Number, Start Time, End Time, Creation Time, Alert Type, Actions. Videos support Download, Online Viewing, Delete.

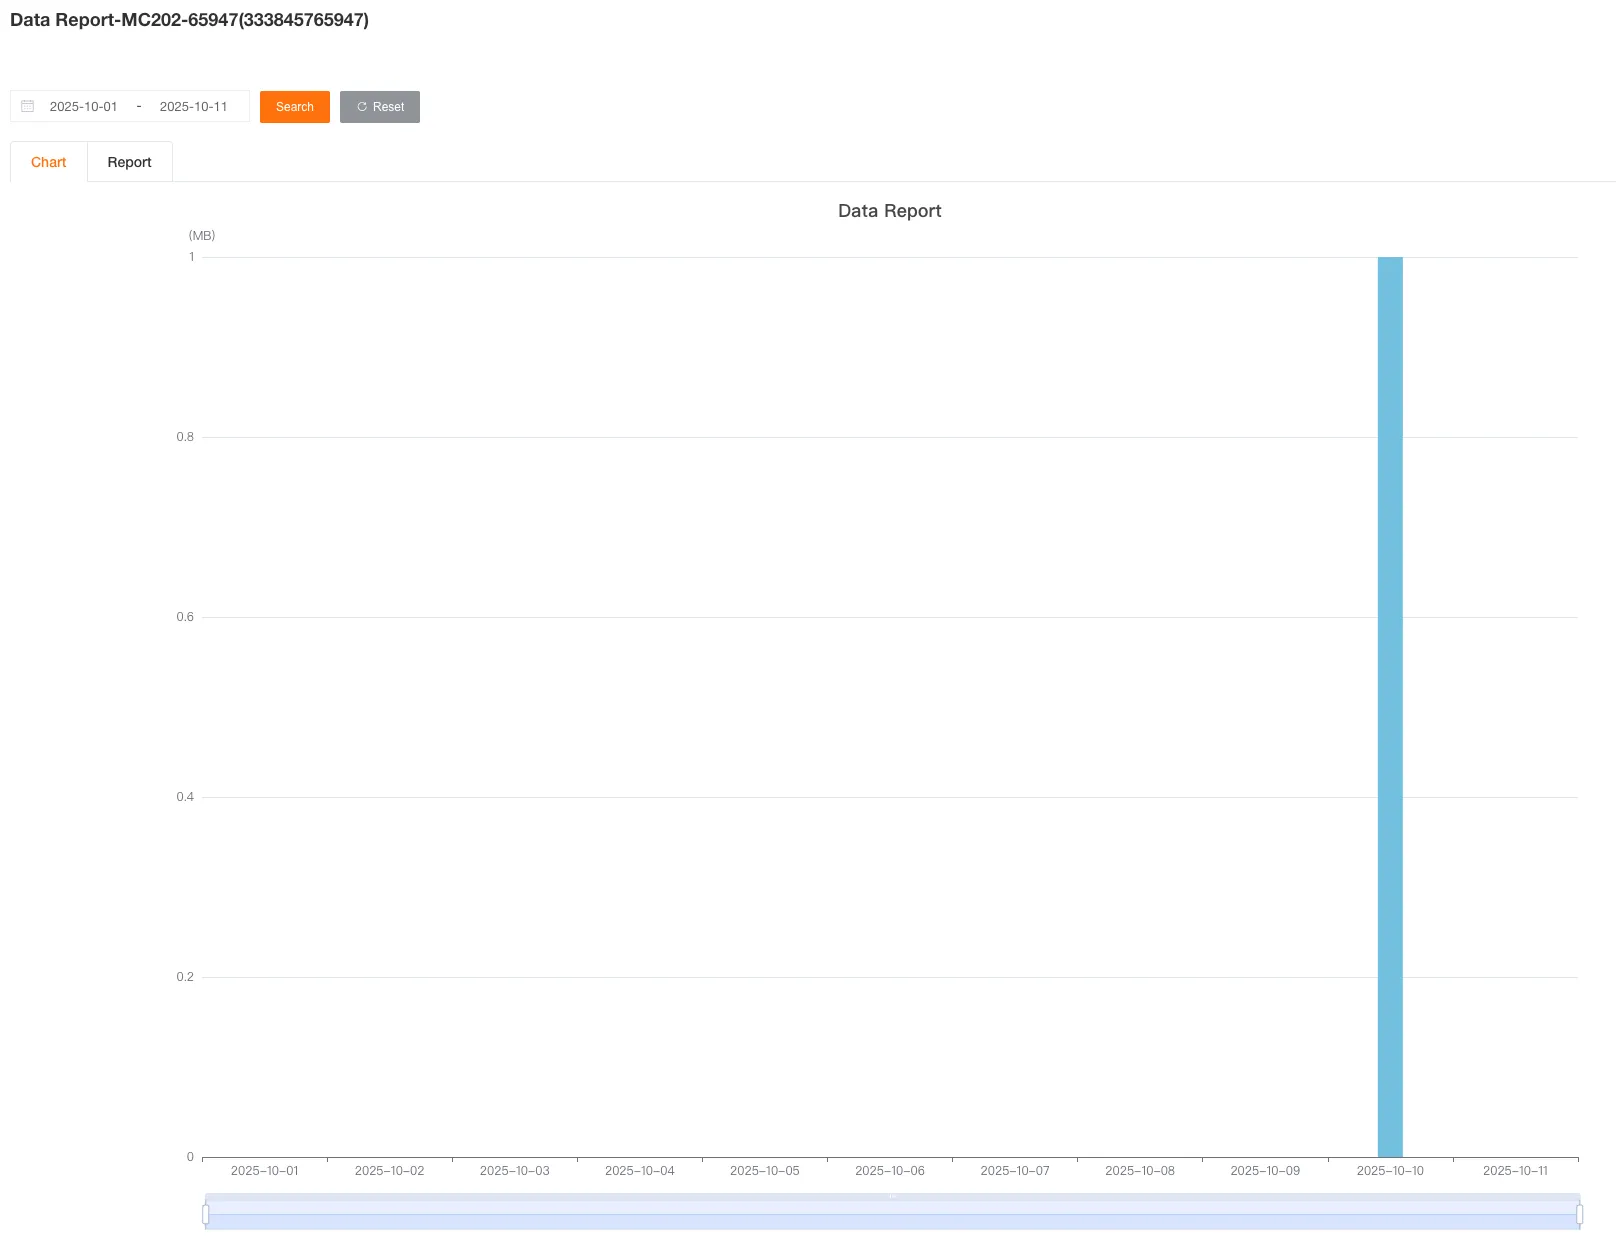
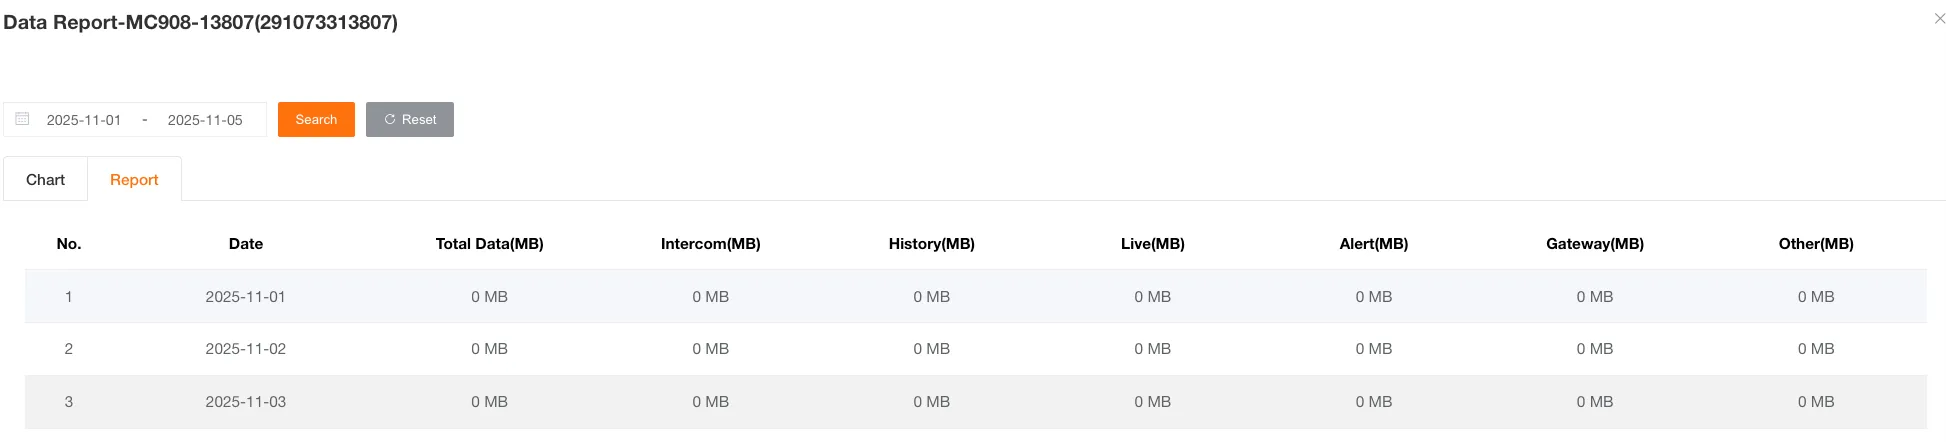
Flow Statistics Report
Section titled “Flow Statistics Report”Used to query the traffic consumption of devices. Can be filtered by date and customer or device.
The form includes Device Name, Unique ID, Traffic (MB).
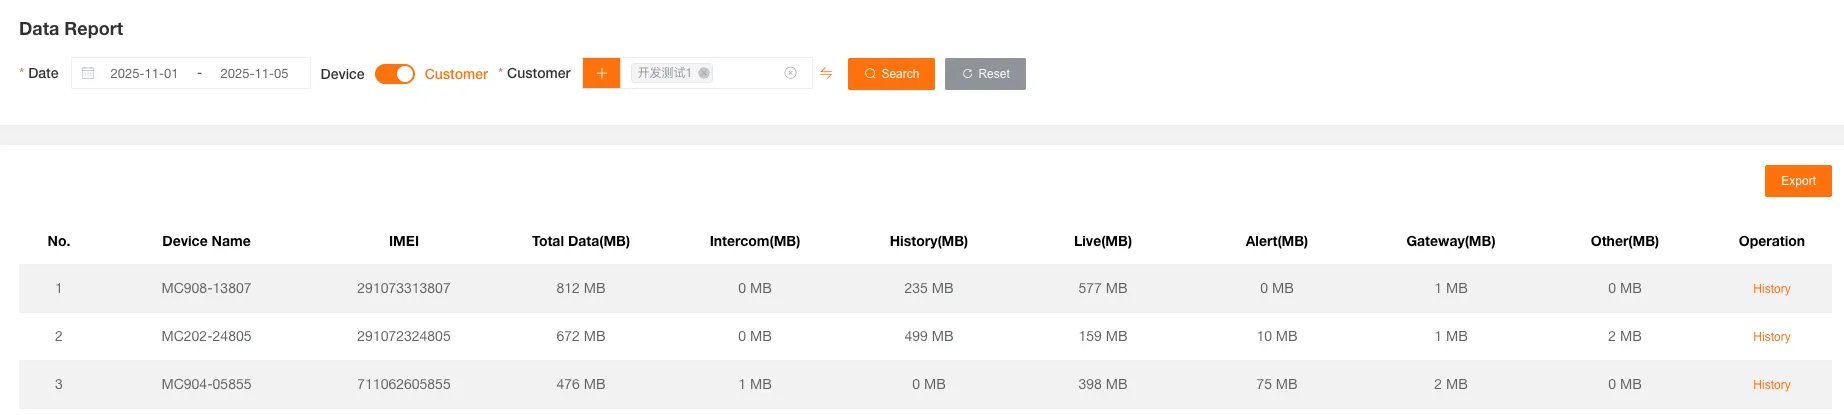
Click History to view daily traffic consumption data for the selected device.
Alert Summary Report
Section titled “Alert Summary Report”Used to query the summary of alert occurrences. Can be filtered by date, customer or device, and alert type.
The form includes Device Name, Unique ID, Selected Alerts, and All.
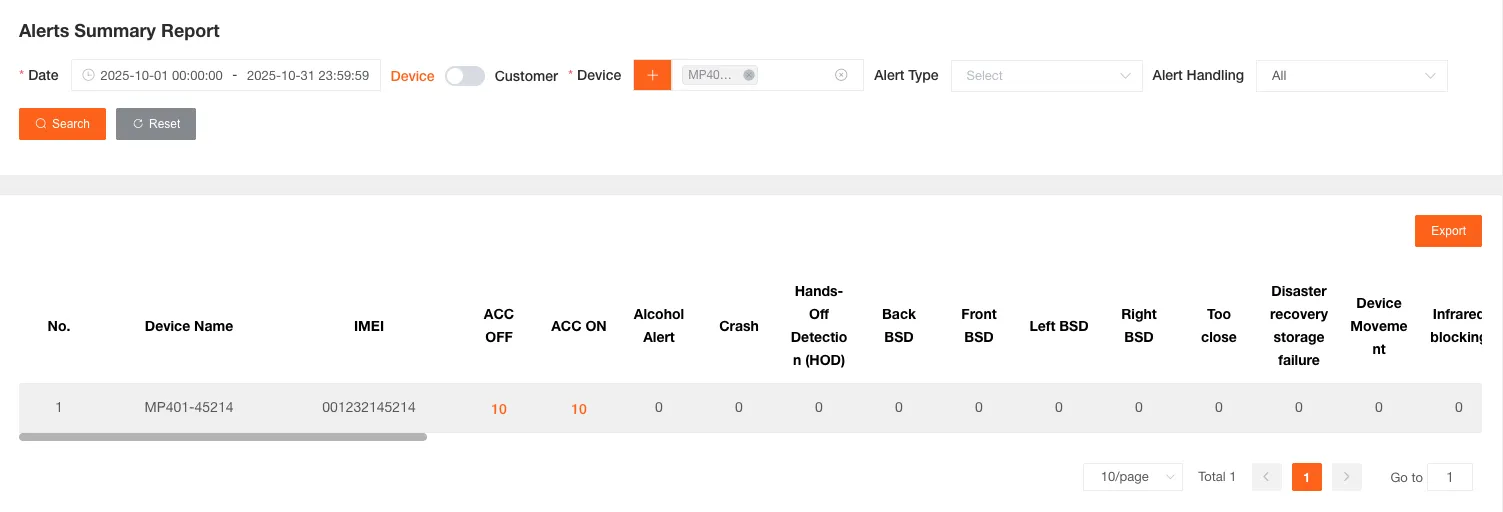
Click on any alert count to jump to the details page to view the specific information of all alerts of that type. Clicking Alert Points will also show their locations on the map.
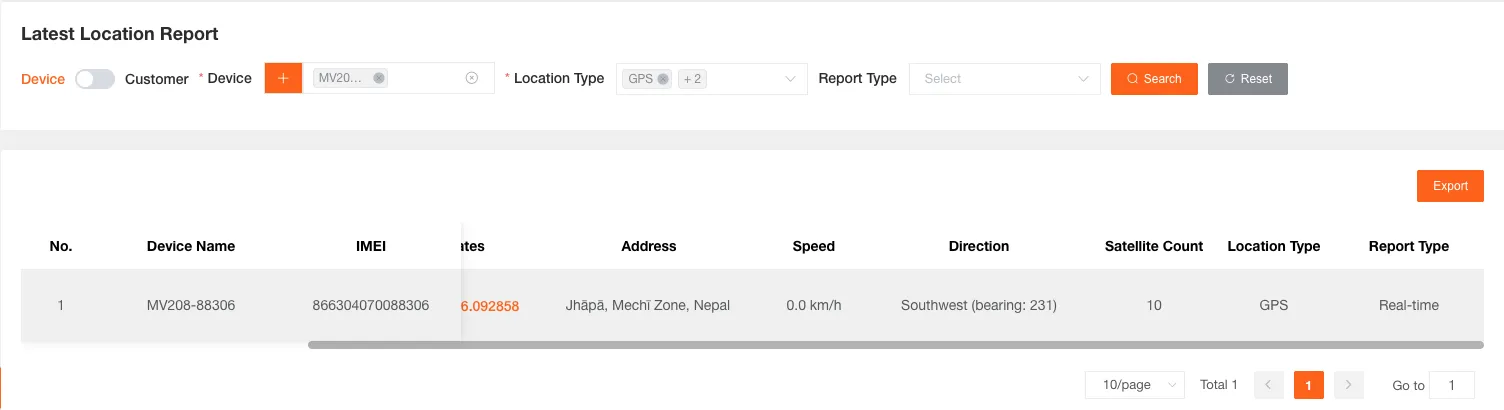
Latest Location Report
Section titled “Latest Location Report”Used to query the data of the device’s last positioning. Can be filtered by customer or device, positioning type, and report type.
The form includes Device Name, Unique ID, ACC Status, Coordinates, Address, Speed, Direction, Number of Satellites, Positioning Type, Report Type.
Sensor Report
Section titled “Sensor Report”Used to query the reporting record data of various sensors on devices. Can be filtered by date, customer or device, and sensor type.
The form includes Device Name, Unique ID, Sensor Number, Sensor Type, Sensor Name, Attribute Number, Attribute Name, Attribute Value, Report Time.
Based on the configured sensor types, the Attribute Name and Attribute Value fields will vary:
- Temperature and Humidity Sensor: Temperature (℃), Humidity (%)
- Bluetooth Sensor (Door Magnet): Door Status, Door Magnet Battery (%), MAC Address
- Bluetooth Sensor (Fuel Detection): Personnel Proximity Detection, Fuel Tank Level, Remaining Fuel, MAC Address
- Tire Pressure Sensor: RFID, Tire Pressure (kPa), Tire Temperature (℃)
- Alcohol Tester: IMEI, Key, QRCode, Current Value, Comparison Value, Alert Status
- CAN Bus Sensor: OBD Device Status, OBD Battery Voltage (V), OBD Adapter, Engine Speed (RPM), Instantaneous Speed (KM/H), Coolant Temperature (℃), Fault Light, Engine Load Percentage, Throttle Pedal Position, Engine Throttle, Engine Intake Air Mass Flow Rate, Air Pressure (kPa), Time After Engine Start, VIN, Total Mileage (KM), Total Fuel Consumption (L), Fuel Level (%)
- Liquid Level Sensor: Fuel Tank Level (mm), Remaining Fuel (L)
- ADC Voltage Sensor: Voltage (mV), Remaining Fuel (L)